Fed Dynamics In-Depth: Rate Decision Mechanism and Transmission Logic to U.S. Stocks
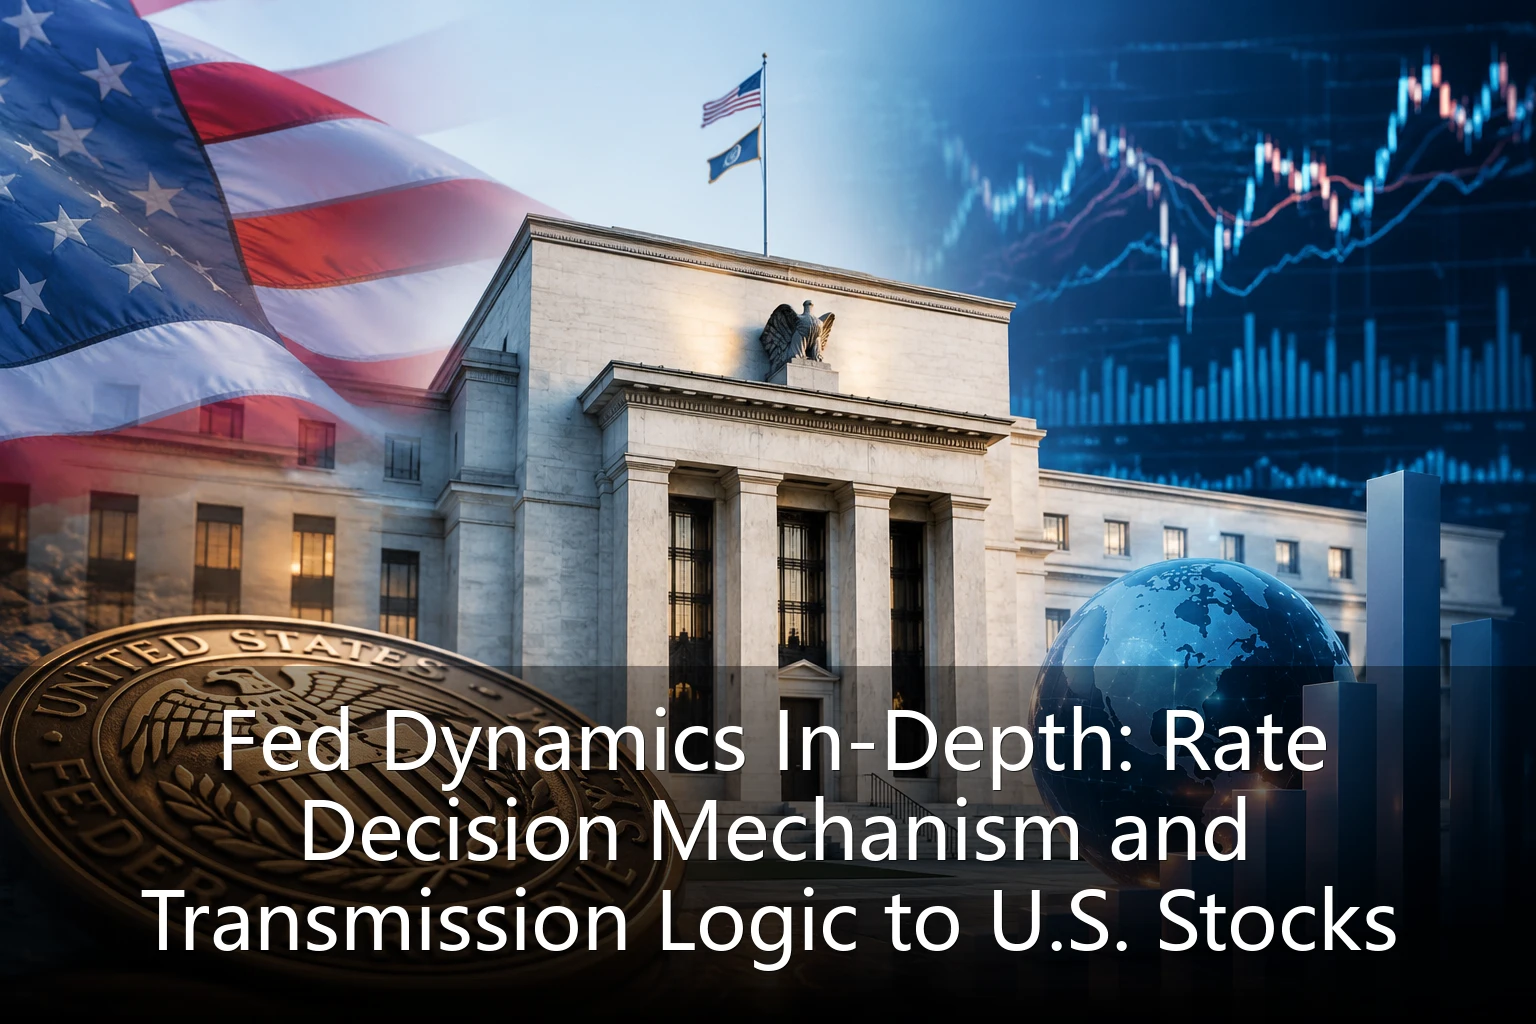
As one of the most influential central banks in the world, every policy move by the Federal Reserve triggers sharp swings in the U.S. stock market. From the aggressive hiking cycle launched in 2022, to the rate-cut expectation management that began in 2024, and the反复 back-and-forth on monetary policy in 2025, Fed dynamics remain the most-watched macro variable for U.S. equity investors. This article systematically breaks down the Fed's operating mechanism, core policy tools, and multi-layered transmission effects on U.S. stocks from a professional perspective.
I. Fed Organizational Structure and Decision-Making Mechanism
The Fed adopts a unique "dual-layer system." The top decision-making body is the Federal Open Market Committee (FOMC), composed of 12 voting members: 7 governors of the Board of Governors in Washington, D.C., the president of the Federal Reserve Bank of New York, and 4 other Reserve Bank presidents (on a rotating basis). The FOMC holds 8 regular meetings each year, communicating outcomes to markets through three channels: the statement, the dot plot, and the Summary of Economic Projections (SEP).
The core agenda of FOMC meetings is to set the target range for the federal funds rate. The federal funds rate is the overnight interbank lending rate. Although it appears to be merely a short-term rate benchmark, it serves as the "anchor" for the entire U.S. financial rate system. From mortgage rates to corporate bond financing costs, from money market fund yields to consumer credit pricing, all are priced off the federal funds rate.
II. Operating Logic of Core Policy Tools
The Fed primarily relies on three tools to steer rates: open market operations (OMO), the discount window, and interest on reserve balances (IORB). OMO is the most important daily tool, executed by the New York Fed trading desk through buying and selling Treasuries and agency mortgage-backed securities (MBS). When the Fed buys Treasuries, liquidity is injected into the market and rates fall; the reverse tightens liquidity and pushes rates up.
Beyond rate tools, the Fed also influences financial conditions through balance sheet policy (QT/QE). During quantitative easing (QE), the Fed bought large amounts of long-term Treasuries and MBS, pushing down long-end yields and lifting asset prices. Quantitative tightening (QT) does the opposite, letting maturing bonds roll off the balance sheet to achieve passive runoff. Balance sheet reduction is often deployed alongside rate hikes, forming a "tightening combo."
Notably, from 2024 the Fed slowed the pace of QT and in 2025 began discussing the timing for ending QT. This shift has particularly significant implications for liquidity-sensitive U.S. tech and growth stocks.
III. Transmission Channels from Rate Decisions to U.S. Stocks
The Fed's impact on U.S. stocks is not a simple "hike down, cut up" pattern, but rather transmitted through multiple channels:
First, the valuation channel. The denominator in equity valuation models (such as the DCF discounted cash flow model) is the discount rate, which is highly correlated with the risk-free rate (typically proxied by the 10-year Treasury yield). When the Fed hikes, the 10-year yield rises and the equity valuation center shifts lower; the reverse expands valuations. This channel hits high-valuation Nasdaq constituents hardest, since growth stocks have a larger share of future cash flows and are more sensitive to discount rate changes.
Second, the corporate earnings channel. Higher rates raise corporate financing costs and interest expenses, squeezing profit margins. The impact is especially pronounced for tech startups reliant on external financing and highly leveraged real estate firms. At the same time, a strong dollar (typically accompanying hiking cycles) erodes the dollar value of overseas earnings for multinationals.
Third, the capital flows channel. Fed rate hikes raise the yield on dollar assets, attracting global capital back to the U.S. Emerging markets face capital outflow pressure, while U.S. equities receive supportive inflows. But when the hiking cycle nears its end and market expectations shift, capital flows can reverse.
Fourth, the market sentiment channel. Every public remark by Fed Chair Powell is parsed word by word by the market. Differences between "hawkish" (more tightening-leaning) and "dovish" (more easing-leaning) wording are directly reflected in the VIX fear index and intraday moves of the S&P 500.
IV. Asymmetric Sector Reactions to Fed Dynamics
Sector sensitivity to Fed policy varies significantly. Financials (especially banks) benefit from rising rates due to wider net interest margins; but when rates rise high enough to spark recession fears, higher loan-loss provisions can hurt earnings. Real estate (REITs) is a "victim" of high rates, since their high-dividend appeal only shines in low-rate environments.
Tech shows a non-linear response: it often sells off early in a hiking cycle (valuation compression), but rebounds first once the market confirms the cycle is nearing its end. The 2023 Nasdaq rally is a textbook case—even as the Fed was still hiking, markets were already pricing in future rate cuts. Consumer staples are tied to employment and wage growth and react to rate policy with a lag.
Energy and consumer staples are viewed as defensive assets, holding up relatively well when economic uncertainty rises. Healthcare, given its essential-demand nature, is less affected by the business cycle and less sensitive to rate policy.
V. A Practical Framework for Reading FOMC Signals
For U.S. equity investors, tracking Fed dynamics requires a systematic analytical framework. First, watch for wording changes in the FOMC statement; the addition or removal of keywords like "data-dependent," "patient," and "sufficiently restrictive" often hints at a policy pivot. Second, watch the Dot Plot, which shows FOMC members' projections for the future rate path and is a key reference for policy direction.
Third, watch the core PCE inflation and unemployment rate projections in the SEP. Fourth, watch Powell's press conference Q&A, which often reveals richer information than the statement. Fifth, watch the "Fed speaking circuit"—public remarks by different regional Fed presidents form a "puzzle" of policy expectations.
From a market-reaction standpoint, investors should distinguish between "expected" and "unexpected" policy moves. If the FOMC decision has been fully priced in (as reflected in fed funds futures), the real volatility often comes in the press conference after the decision; if the policy surprises (such as an unexpected 50 bp hike instead of 25 bp), markets can see sharp repricing.
VI. Fed Dynamics Outlook 2025-2026 and Investment Implications
Looking ahead, the Fed's policy path will hinge on the balance between inflation's pace of decline, labor market resilience, and economic growth. If inflation proves stickier than expected, rate cuts may be delayed, pressuring U.S. equity valuations; if clear signs of economic weakness emerge, the pace of cuts could accelerate, benefiting risk assets. Investors should closely track key data such as monthly CPI, PCE, nonfarm payrolls, and the unemployment rate.
On sector allocation, increase defensive exposure when policy uncertainty is high to reduce portfolio volatility; when rate-cut expectations heat up, overweight rate-sensitive sectors such as tech, biotech, and REITs. At the cross-asset level, monitor the dollar index, the Treasury yield curve shape (especially the 2s10s spread), and safe-haven assets like gold, which often front-run Fed policy pivots.
In short, Fed dynamics are the "chief conductor's baton" of the U.S. stock market, and understanding its decision logic and transmission mechanism is a必修 course for every serious U.S. equity investor. In an information-overloaded market, building a systematic analytical framework and maintaining calm judgment are the keys to capturing real investment opportunities across policy cycles.